Key Updates on the Economy & Markets
Stocks fell in the first quarter after two consecutive years of gains exceeding +20%. The year started off strong, with the S&P 500 reaching a new all-time high in mid-February. However, sentiment shifted late in February amid rising policy uncertainty in Washington, and the S&P 500 ended the quarter down. There are many moving pieces in markets today, and we want to take a moment to share our team’s perspective. In this letter, we’ll discuss the drivers behind the recent market selloff, provide an update on the economy, recap the first quarter, and discuss our forward-looking thoughts on the economy and markets.
Stocks Trade Lower as Valuations Moderate
The big development in Q1 was falling stock market valuations, as rising policy uncertainty weighed on investor sentiment. Wall Street analysts slightly lowered their earnings forecast in Q1, citing the potential for tariffs and slower growth. Investors started to price stocks more conservatively due to concerns about tariffs, slower economic growth, and policy uncertainty. The shift in sentiment during Q1, from optimism to caution, caused valuations to decline and stocks to fall.
Rising Policy Uncertainty is Impacting Sentiment
Developments in Washington took center stage in Q1 as the Trump administration started rolling out its policy agenda. The administration’s early efforts focused on trade policy, tariffs, and reducing government spending. The policies are a notable shift from the status quo and have drawn attention from investors and business leaders due to their potential impact on the economy.
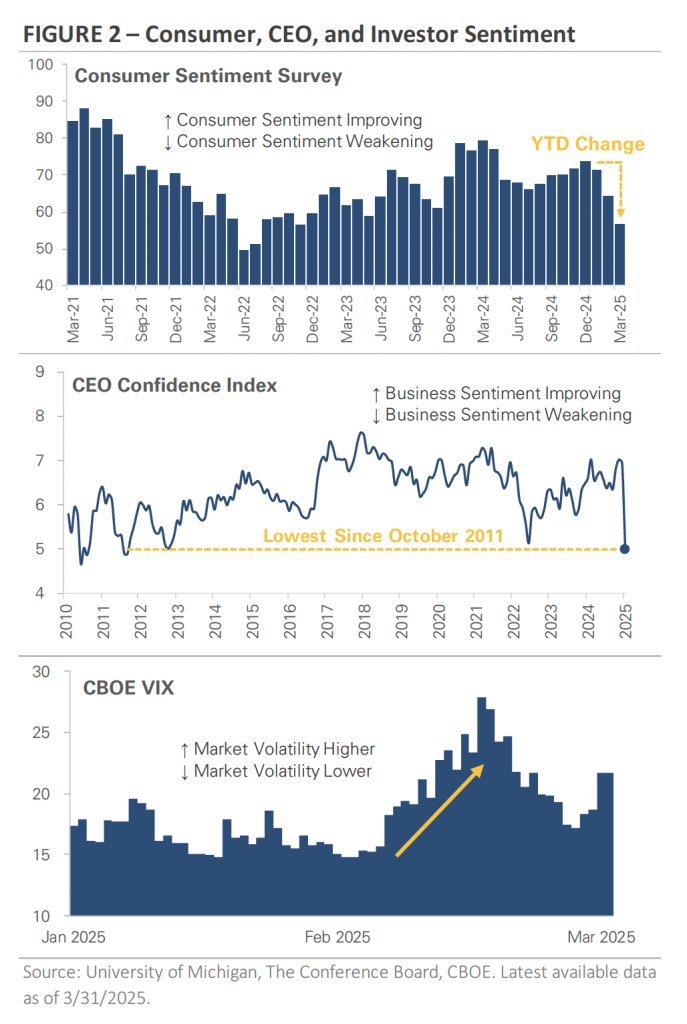
The charts in Figure 2 graph three measures of sentiment. The datasets provide insight into how households, business leaders, and investors view current conditions and what they expect in the future. Tracking sentiment can help gauge potential shifts in consumer spending, business investment, and overall economic momentum.
- Consumer sentiment, as tracked by the University of Michigan’s index, reached a record low in June 2022 due to inflation and economic uncertainty. Although sentiment improved through 2024 amid easing inflation and robust growth, it turned downward again in early 2025, reflecting renewed concerns among consumers who drive economic activity
- CEO confidence, measured by The Conference Board, fell to its lowest level since 2011 in Q1 2025, amid persistent inflation, geopolitical uncertainty, and cautious business planning.
- Market volatility spiked in early 2025, driven by policy uncertainty and stock market sell-offs, suggesting elevated investor apprehension may continue until clarity emerges.
The three measures of sentiment signal a more cautious tone among consumers, business leaders, and investors. This matters because sentiment can impact future behavior. Consumers may cut back on spending, while businesses may delay hiring or investment decisions. Sentiment data will remain in focus in the coming months as more policy details are released.
An Update on the U.S. Economy
It is important to remember that the stock market isn’t the economy. In other words, the performance of the stock market doesn’t always reflect real-time economic conditions. This is because the market is forward-looking and prices in expectations for what’s to come. The previous section highlighted how rising policy uncertainty affected sentiment in Q1, and this section examines the latest economic data.
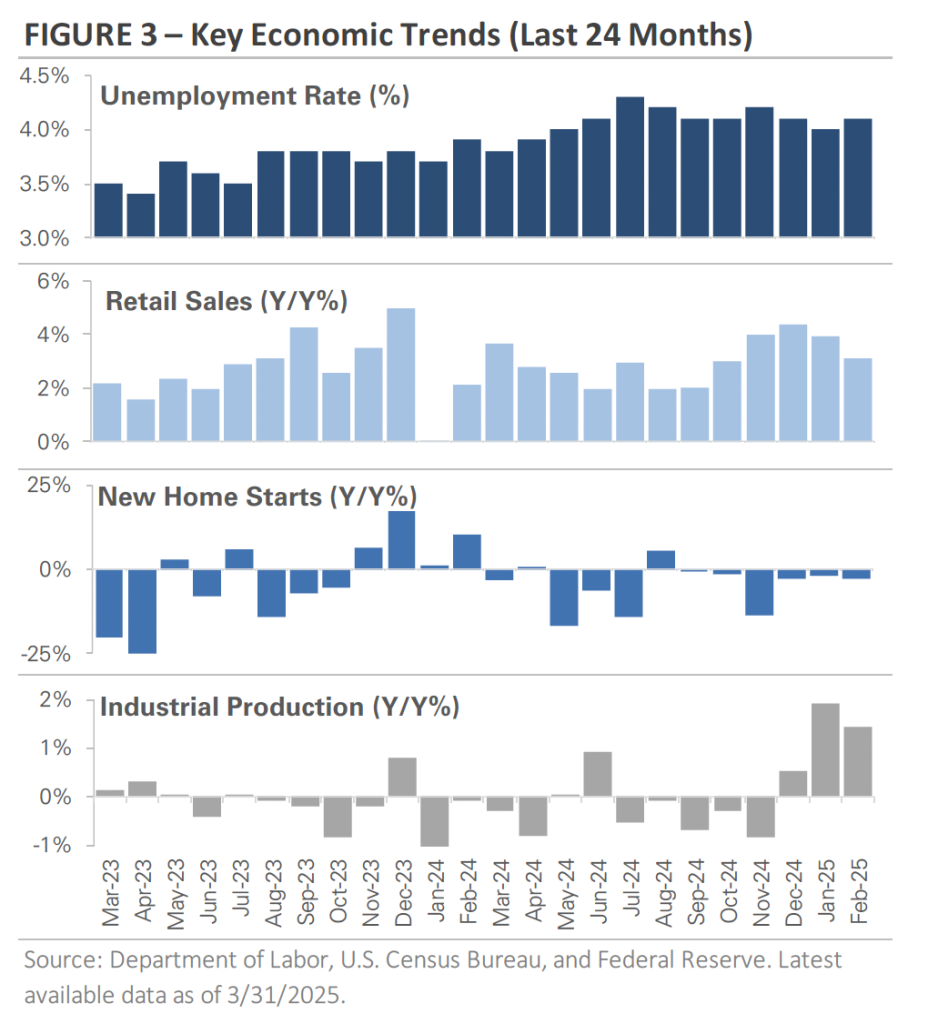
Figure 3 graphs four economic indicators that offer insight into the state of the U.S. economy: the unemployment rate, retail sales, housing starts, and industrial production.
- The U.S. unemployment rate remains historically low despite some fluctuations, reflecting a resilient labor market with a strong demand for workers.
- Retail sales growth slowed in 2024 as cautious consumer spending emerged due to high interest rates and persistent inflation. Consumer spending makes up almost 70% of U.S. GDP, so a continued slowdown could have implications for the broader economy.
- The housing market faces challenges from elevated mortgage rates, as well as tariff and immigration policy uncertainty. That being said, housing starts remain above pre-pandemic levels.
- Industrial production, after flat or declining activity in 2023 and 2024, is now recovering at its fastest pace since late 2022. The question is, how will tariffs impact manufacturing as 2025 progresses?
Together, the data suggests the U.S. economy is losing some momentum. However, they also show the economy continues to expand, just at a slower pace. The labor market remains solid, and consumer spending is holding steady. The housing sector has cooled from its pandemic highs, but it still exceeds the pace from the 2010s. Meanwhile, manufacturing activity is showing renewed strength. The risk moving forward is that policy uncertainty could weigh on confidence and trigger a slowdown. Economic data will be in focus in the coming months.
Equity Market Recap – Looking Beyond the Index
There were two notable themes in the bond market in Q1: Most of the stock market decline occurred in the second half of the quarter, after the S&P 500 set a new all-time high on February 19th. A small group of mega-cap stocks drove the selloff, and their size and weight within broad stock market indices impacted performance trends. The Nasdaq 100, an index of leading technology companies that include the Magnificent 7, returned -8%.
Sector returns highlight the concentrated nature of the selloff. Technology and Consumer Discretionary, two of last year’s top performers, are the two worst performing sectors this year. It’s not a coincidence that these sectors are the most exposed to the Magnificent 7, which has weighed on their returns just like the broader S&P 500. In contrast, sectors that underperformed in 2024 are the top-performing sectors this year. While the S&P 500 is down by -4.3%, the average stock within the index is down -1%.
International stocks outperformed U.S. stocks in Q1, posting one of its biggest quarters of outperformance since 2000. The underperformance of U.S. mega-cap tech stocks contributed to international’s outperformance. Outside the U.S., the MSCI EAFE Index of developed market stocks gained +8% in Q1. Much of that strength came from Europe, where investor sentiment improved as governments unveiled plans to increase spending. Meanwhile, the MSCI Emerging Index gained +4.5% in Q1.
Credit Market Recap – Bonds Trade Higher in Q1
There were two notable themes in the bond market in Q1: falling U.S. Treasury bond yields and wider credit spreads. The 10-year Treasury yield fell from a peak of around 4.80% in mid-January to 4.15% in early March. Several factors contributed to the Q1 reversal, including rising policy uncertainty, the potential for tariffs, and concerns about slower economic growth. The combination prompted investors to move money into longer-maturity government bonds, which are viewed as safe havens. Bond prices rise as yields decline, and Treasury bonds provided diversification benefits in Q1, offsetting a portion of the stock market decline.
Another major theme was credit spread expansion. Credit spreads measure the difference in yield between high-yield corporate bonds and safer government bonds, such as U.S. Treasuries. Spread levels can serve as a real-time gauge of market sentiment, showing how easy or expensive it is for companies to borrow money. A narrower spread signals that investors view credit risk as low, while a wider spread signals higher perceived default risk.
Recently, we’ve seen a slight increase in credit spreads. The increase indicates investors are becoming more cautious, with the potential for tariffs and slower economic growth leading to higher credit risk. That being said, Credit spreads remain low by historical standards. Compared to past periods of market stress, today’s spread levels suggest financial conditions are still relatively stable, a reflection of the U.S. economy’s overall strength. While investors are concerned about policy uncertainty and the potential for slower growth, the market is not signaling financial distress. The market will be watching spreads closely.
2025 Outlook – Maintaining a Long-Term View
Market volatility can be unsettling, but it’s a normal part of investing. Periods of enthusiasm often lead to recalibration. It’s natural to feel uncertain, but history shows that staying invested through volatility and maintaining a longer-term perspective is the prudent approach. Figure 5 puts the Q1 market volatility and selloff into perspective. It uses almost a century of S&P 500 price data to show that market pullbacks like this year are not just common—they’re a healthy and recurring part of investing. The chart graphs annual drawdowns, or the largest peak-to-trough decline within each calendar year. The bars show the S&P 500 experiences a pullback nearly every year, with a median intra-year drawdown of -13%. Since 1928, the S&P 500 has experienced a drawdown of -5% or more in 91 out of 98 calendar years, including 2025.

The chart highlights a fundamental reality of investing: market corrections are a normal part of the cycle. These periods can be uncomfortable, but they serve the important functions of resetting valuations and curbing speculative excess. Without occasional declines, markets could become dangerously overextended, increasing the risk of more severe and extended downturns.
Despite these frequent and sometimes severe drawdowns, the S&P 500 has delivered strong returns over nearly a century. This is despite wars, recessions, inflation spikes, financial crises, and a global pandemic. The upward trajectory is driven by economic growth, innovation, and corporate earnings growth. The key takeaway for investors: volatility isn’t a sign that something is broken—it’s the price of admission to investing. Staying invested through ups and downs has consistently been one of the most effective strategies for building wealth over time. Market declines can feel unsettling in the moment, but history shows the powerful effect of compounding returns over time.
Disclosure: This article is distributed for general informational and educational purposes only and is not intended to constitute legal, tax, accounting, or investment advice. The information, opinions and views contained herein are current only as of the date hereof and may be subject to change at any time without prior notice. All investment strategies and investments involve risk of loss.